Valentyn Hatsko, Dmytro Andreiev (both Kyiv School of Economics)
Ukrainians regularly encounter opinion polls in the media, e.g. on governmental trust, negotiations, or corruption. Yet they rarely explain how these surveys are conducted. An analysis of more than 15,000 news items shows that polling results are widely reported, while methodological information is largely omitted.
Why study how media report polls?
Opinion surveys are a key source of information about public moods, political preferences and social change, but their public meaning to a large degree depends on how media present them. A publication that carries only headline numbers, with no word on how the data were produced, gives readers no way to assess reliability. This analysis focuses not on the surveys themselves but on how they are made public in Ukraine.
Data and methodology
The study analyses news items collected by the agency LOOQME for July-September 2025. The initial corpus of 28,996 publications was matched on the keywords “опитування” (survey), “соціологічне дослідження” (sociological research) and “дослідження громадської думки” (public opinion research). After filtering for items in online media, news agencies and the print press that contained the results of a specific opinion survey, 15,603 publications remained, with more than 94% from online outlets.
For each publication we coded the presence of 10 methodological elements drawn from the disclosure standards of the American Association for Public Opinion Research (AAPOR), the main professional body of survey researchers in the US, whose disclosure norms are widely adopted as an international benchmark and reflected in the ESOMAR/WAPOR codes that Ukrainian pollsters such as KIIS and the Sociological Association of Ukraine formally subscribe to. These elements were used to compute a Transparency Index running from 0 to 1, with low/medium/high bands.
Figure 1. The Transparency Index
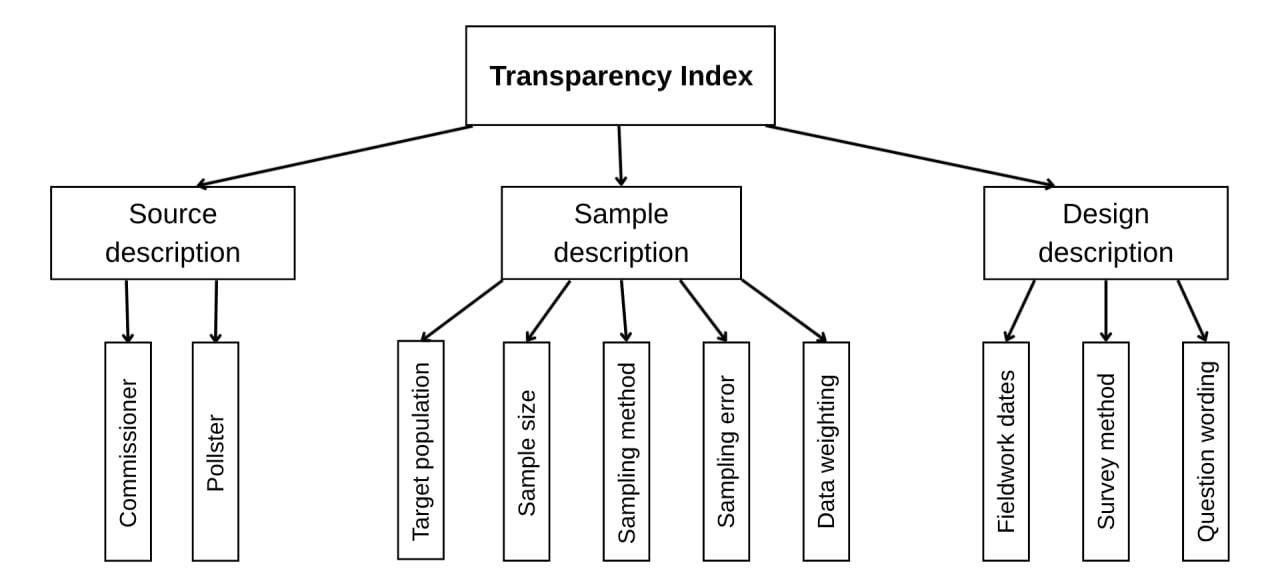
The index is built from 10 elements organised into three dimensions:
source description (commissioner, pollster),
sample description (target population, sample size, sampling method, sampling error, data weighting),
design description (fieldwork dates, survey method, question wording).
The overall score is the unweighted mean of the three block scores, with each block scored as the share of indicators present. Blocks are weighted equally because we have no principled basis for weighting them otherwise. Justifying unequal weights would require either a theoretical argument about which dimension matters most, or an expert elicitation we did not conduct. To facilitate interpretation, overall compliance scores were grouped into three levels: low [0-0.3), medium [0.3-0.6), and high [0.6-1].
Coding combined automated text processing via the OpenAI API with manual verification on a 100-item control sample, with at least 89% agreement on every disclosure element. Agreement with manual coding, by element: commissioner 89%, pollster 89%, target population 93%, sample size 96%, sampling method 98%, sampling error 100%, data weighting 100%, fieldwork dates 93%, survey method 98%, question wording 99%.
Focus on numbers, not methodology
Only a few methodological details are reported consistently. The target population (often as simple as “adult citizens of Ukraine”) appears in 89% of items and the polling organisation in 62%. After that, reporting drops off sharply: fieldwork dates are reported in 47% of news items, commissioner 39%, sample size 33%. The missing commissioner matters most in our opinion, because without it, readers cannot judge whose interests the survey may serve.
For example, a news article may report that “57% of Ukrainians oppose elections during wartime” with no mention of who paid for the survey. The same figure carries quite different weight depending on whether the poll was commissioned by a foreign democracy-promotion organisation, a Ukrainian opposition party, a government-aligned think tank, or the pollster on its own initiative — each has distinct incentives that shape question wording, item ordering, and which findings are pushed to the headline. This is not a hypothetical concern: between 2023 and 2026, broadly similar headline figures on wartime elections have circulated from polls commissioned by IRI (with USAID funding), the Konrad Adenauer Foundation (via Razumkov Centre), the Westminster Foundation for Democracy, and from KIIS omnibus waves run on the institute's own initiative - yet the questionnaires, response options, and emphasised findings differ in ways the casual reader never sees. Without naming the commissioner, the news item leaves the reader unable to apply that calibration.
Figure 2. Methodological elements present in news publications
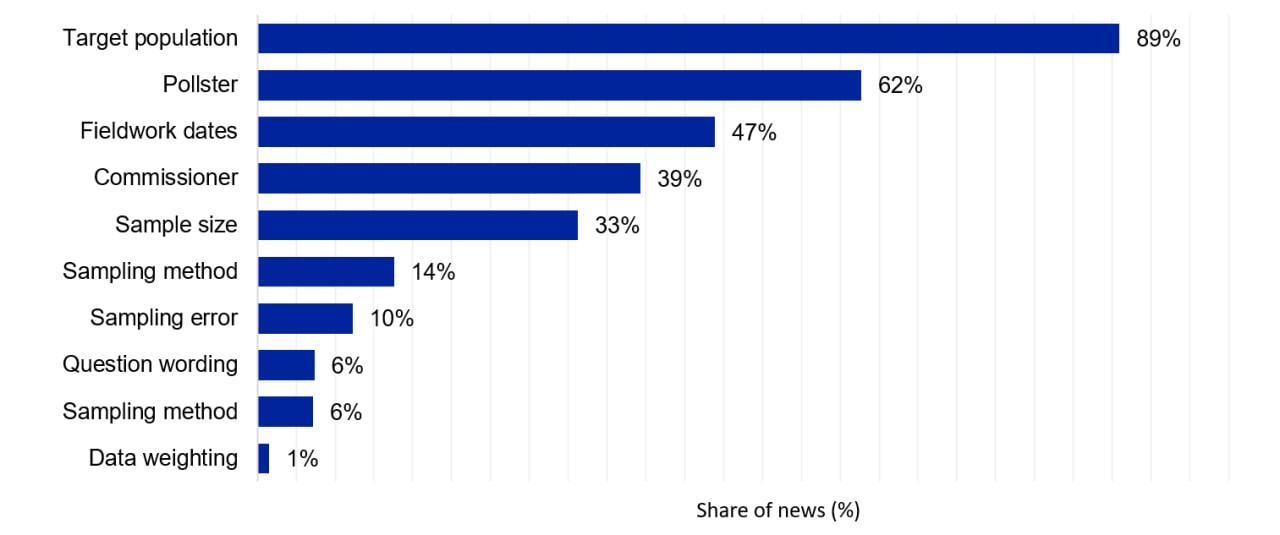
Note. Each publication was scored on 10 AAPOR elements as separate dichotomous variables, so percentages do not sum to 100. Shares are computed against the full corpus.
Question wording (6%), sampling method (6%) and weighting (1%) almost never appear. The very low weighting figure is partly not the journalists' fault: not every survey is weighted, and pollster reports themselves often omit weighting details. Question wording is sometimes shown inside the chart accompanying a story rather than written into the text, and we coded only the text, so the 6% is an upper bound on absence.
Detailed methodological reporting is not always required: a brief mention can just link to the source. But when the survey is the news item's main topic, basic disclosure is the minimum readers need. On the survey-focused subset, only 21.2% reach the high band; 62.2% are medium and 16.5% are low.
Conclusion
In wartime Ukraine, polling figures circulate fast through (inter-) national media, and feed high-stakes debates over morale, leadership, openness to compromise, and the terms of a possible peace. When nearly half of survey-related stories carry only fragments of methodology, readers cannot easily tell a real trend from a methodological artefact. For international audiences whose primary exposure to Ukrainian polling comes through the press, going back to the original pollster report is the safer route.
The fix is simple. A short standardised methodological footer on survey-focused stories (pollster, commissioner, fieldwork dates, sample size, method, sampling error) would lift most coverage out of the low band, and the responsibility for adding it falls on both pollsters and journalists. Given that 94% of publications are online, this should be readily feasible, as digital formats impose virtually no space constraints compared to print media.
As this monitoring will be continued quarterly, more findings will come from change over time.
Notes on methodology
The coding pipeline ran in four steps using custom-built prompts and the OpenAI API: filtering the corpus for items containing actual survey results; extracting pollster and commissioner names; standardising those names (the same organisation can appear as “КМІС”, “Київський міжнародний інститут соціології” and “KIIS” within a single news cycle); and scoring each publication on the ten AAPOR elements alongside a topic classification using a 17-category scheme adapted from the Comparative Agendas Project. Both GPT-4o and GPT-4o mini were used, with the choice of model varying by task to balance accuracy and cost. For a more detailed understanding, we also recommend consulting another publication.
About the authors
Valentyn Hatsko is a senior analyst at the Center for Sociological Research at the Kyiv School of Economics (KSE). His research interests are political trust, local governance, decentralization reforms, education and science policy. vhatsko@kse.org.ua
Dmytro Andreiev is a junior analyst at the Center for Sociological Research at the Kyiv School of Economics (KSE). His research interests are quantitative data analysis, electoral sociology, political trust, wars and conflicts, demography. d.andreiev@kse.org.ua
Further reading
Gahner Larsen, E., & Straubinger, S. G. (2012). Mediernes formidling af meningsmålinger: Indholdsanalyse af folketingsvalg, 2005–2011. Tidsskriftet Politik, 15(3), 54–63. https://doi.org/10.7146/politik.v15i3.27522
Gosselin, T., & Pétry, F. (2009). The regulation of poll reporting in Canada. Canadian Public Policy, 35(1), 41–57. https://doi.org/10.3138/cpp.35.1.41
Miller, M. M., & Hurd, R. (1982). Conformity to AAPOR standards in newspaper reporting of public opinion polls. Public Opinion Quarterly, 46(2), 243–249. https://doi.org/10.1086/268716
Turcotte, J., Medenilla, K., Villaseñor, K., & Lampwalla, S. (2017). All the polling (data) that's fit to print? An analysis of online news coverage of 2016 primary polls. Communication Research Reports, 34(3), 191–200. https://doi.org/10.1080/08824096.2017.1282856